Takeaway points:
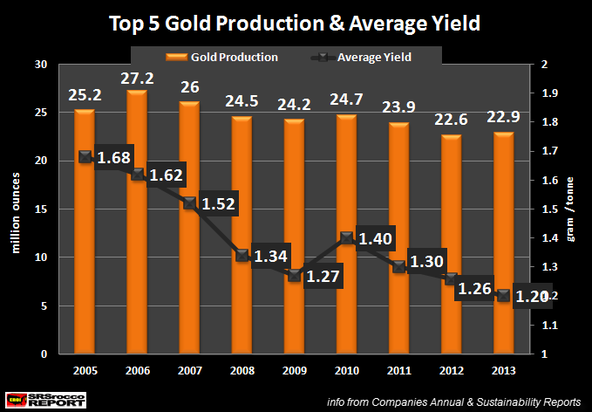
The top five gold miners’ average yield declined another 5% in 2013. Average yield fell from 1.26 grams per ton (g/t) in 2012 to 1.20 g/t in 2013.
Newmont Mining:
2005 Waste Rock/Production Ratio = 52 metric tons/ gold oz
2013 Waste Rock/Production Ratio = 113 metric tons/ gold oz
2005 Newmont consumed 19 gallons of diesel in its operations to produce one ounce of gold.
By 2012, this increased to a staggering 31 gallons per ounce…. a 63% increase in seven years.
——————————--
Link: http://srsroccoreport.com/top-gold-miners-yields-fall-to-the-lowest-level-ever/top-gold-miners-yields-fall-to-the-lowest-level-ever/
With the results for 2013 finally in, the top gold miners average yield fell to the lowest level ever. This is a surprising development considering that the average price of gold dropped to a low of $1,411 in 2013. Normally when the price of gold falls, gold miners switch to higher grades to remain profitable.
However, the top five gold miners’ average yield declined another 5% in 2013. If we look at the chart below, the top five gold miners (Barrick, Newmont, AngloGold, Goldfields* & Goldcorp) average yield fell from 1.26 grams per ton (g/t) in 2012 to 1.20 g/t in 2013.
(*Note: GoldFields spun-off three mines into a new company called Sibanye Gold in 2012. The data below includes both companies listed as GoldFields.)
Top 5 Gold Production & Average Yield 2005-2013
Furthermore, the average gold yield for the group declined from 1.68 g/t in 2005 to 1.20 g/t in 2013. Which means these miners lost 0.48 g/t in just eight years… a 29% decline. That might not sound like a lot, but if we do the math… it’s a substantial loss.
Read more


 RSS Feed